Last updated on March 9th, 2023 at 11:01 am
If you have experience in developing Angular applications, you may know that debugging production-ready Angular applications is challenging because of the Uglify tool that obfuscates the code. Even when you prettify the code, it is still difficult to read because ng command removes all the source map files (.map files) in production builds.
Fortunately, there is a workaround to add source maps to your production Angular apps, which enables you to debug your application with ease. Before we get started, you must have the exact code base of the Angular application you want to debug.
Here are the steps to add source maps to your production Angular app:
Prerequisites to debug your production Javascript app:
You must have the exact code base of the angular application you want to debug.
Here are the steps:
- Open the angular.json file and update the sourceMap key. If you’re using Angular 8 or newer, the following configuration should work:
// on Angular 8 or up
"configurations": {
            "production": {
              "optimization": true,
              "outputHashing": "all",
              "sourceMap": {
                "hidden": true,
                "scripts": true,
                "styles": true
              },,
              "extractCss": true,
              "namedChunks": false,
              "aot": true,
              "extractLicenses": true,
              "vendorChunk": false,
              "buildOptimizer": true
            }
}- Save the changes to the file, and then create a new build using the following command:
ng build --prod3. Once the build process completes, locate the dist folder, and you will find that source maps are now generated. Copy the file path for the main.xxxxxx.js.map file.
4. In Google Chrome, go to your production Angular app and open the Chrome debugger. Then, under the Sources tab, open the main.xxxxxx.js file.
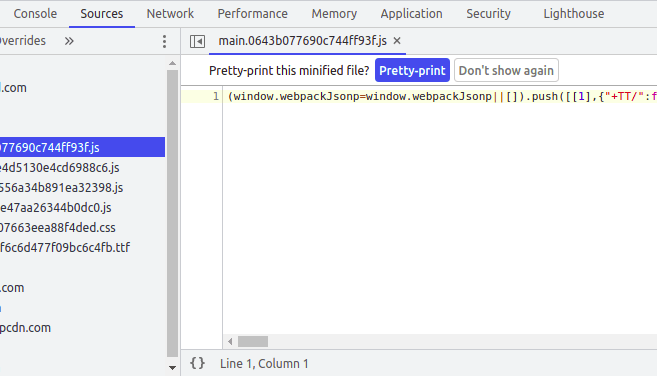
5. Right click on the empty space in the source panel and you will find the option to Add Source Maps. Click on it and paste the copied path and Done.


6. After following the above steps, you should now see “webpack://” in the left section of the Chrome debugger. Under the “src” directory, you will find the complete source code of your application.

In conclusion, debugging production-ready Angular applications can be challenging because of the obfuscated code that Uglify generates. However, by following the steps mentioned above, you can add source maps to your production Angular apps and enable easy debugging. Remember, it’s crucial to have the exact code base of your Angular application to ensure successful debugging.
By taking the time to improve your debugging skills, you can become a more efficient and effective developer. If you’re interested in learning more about JavaScript, be sure to read “5 things you might be doing wrong in JavaScript” to improve your coding practices. Happy debugging and coding!
Discover more from kumarvinay.com
Subscribe to get the latest posts sent to your email.